


On Twitter, a few people I follow post some fantastic pictures of generative art they are "printing" with plotters. If you're not familiar with plotters, think of them as laser cutters with a pen that creates drawing on paper. The basic concept is that you feed the plotter x, y, and z coordinates, then it does the rest. But that's too simple for someone like me, so I decided to jump down the rabbit hole and not only bought a plotter, I got a programable robot arm that does 3d printing and laser engraving as well!
I've wanted to buy a plotter for a long time, and after making my Ludum Dare game, Space Station 8, it got me thinking it would be cool if I could also print the levels people make with my game.
Buying A Robot Arm
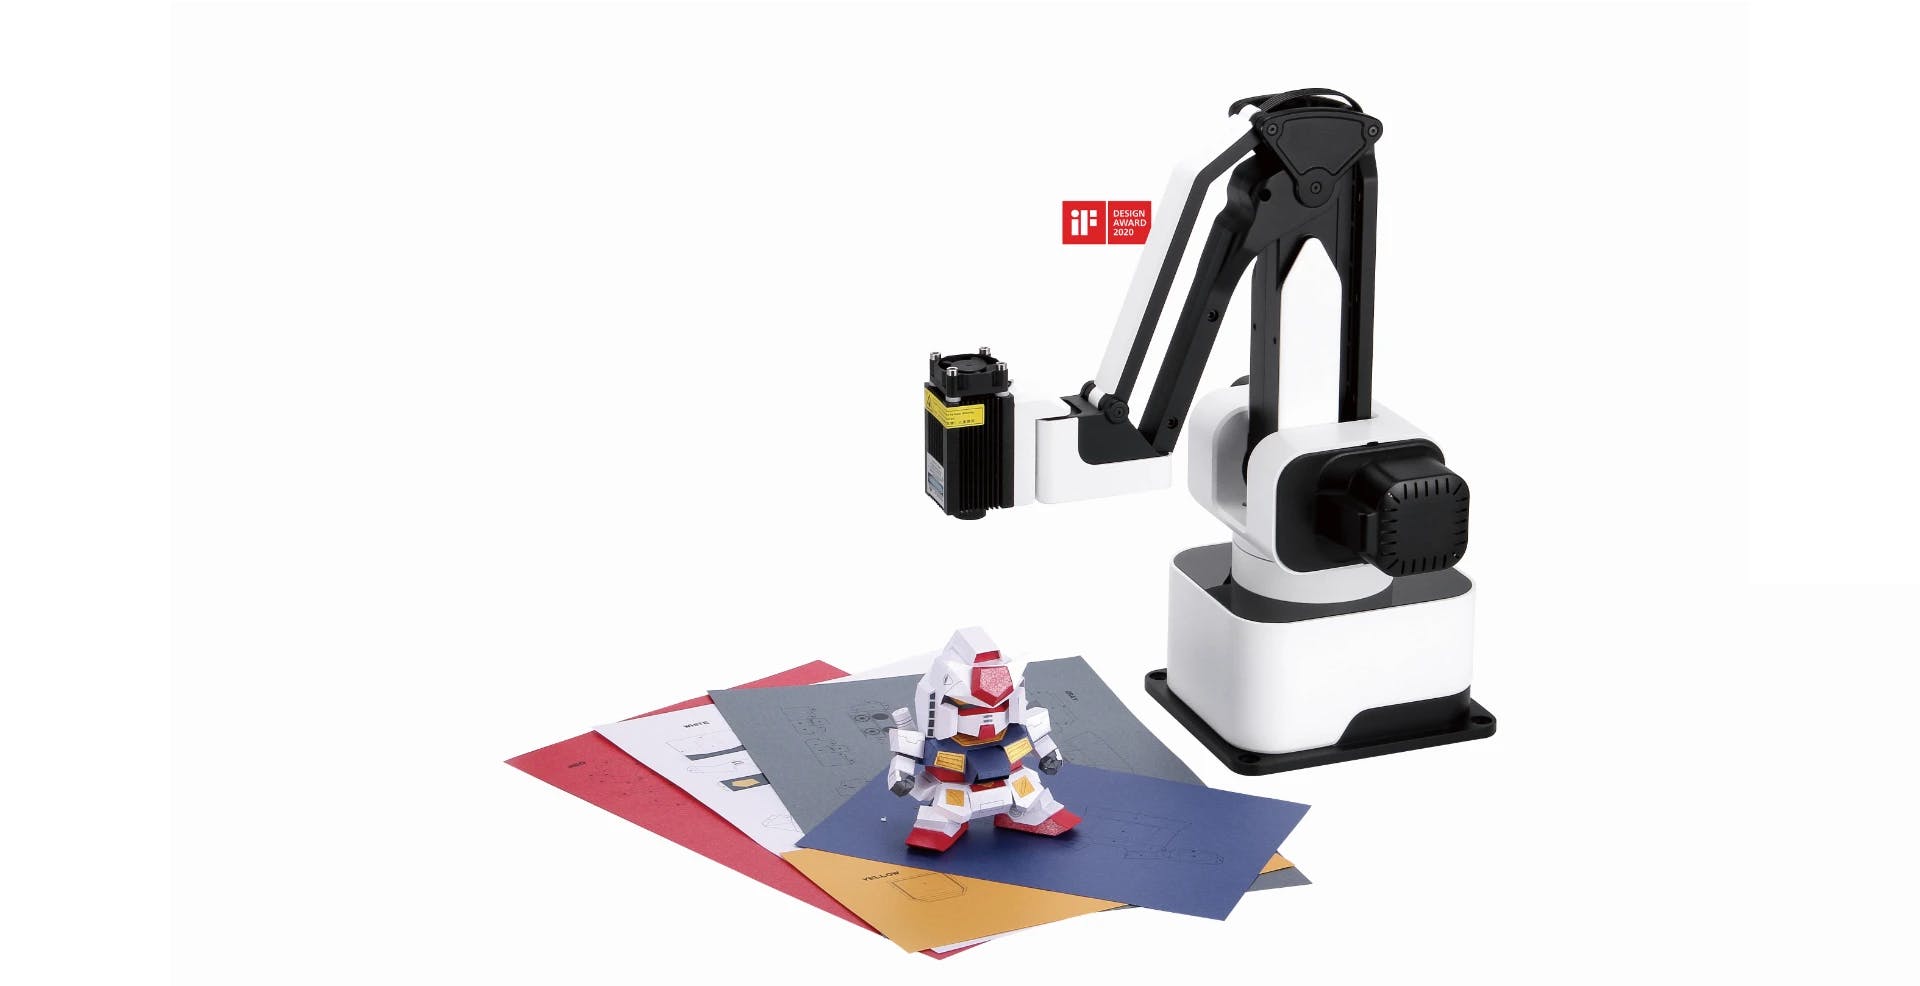
Originally I wanted to spend the least amount possible on a plotter because I tend to accumulate these random hardware projects that end up collecting dust somewhere in the corner of my office when I'm done. Of course, when I came across Rotrics DexArm, an all-in-one desktop robotic arm (not a plug), I was really curious. I've also been interested in 3D printing years ago when I worked at Microsoft and was involved in the built-in printer support added to Windows 8. What sold me was that it also supported coding with scratch, which my oldest son (11) is learning in school, and honestly, who doesn't want a programmable robot arm?
For the past 2 days now, I have been experimenting with different ways to convert my pixel art into something the arm could draw. I picked one up off Amazon for roughly $1k and got to work with it as soon as it arrived. It accepts SVG but converting raster graphics into SVG doesn't create perfect results, especially something as precise as pixel art. So I cracked open Visual Studio Code and got to work. While I'm still trying to figure out the right combinations of pens, paper, scaling, and settings, I wanted to share a super simple script I wrote that converts my pixel art into SVG. I hope that it gives you some insight into how I usually hack together little utility scripts to solve this problem.
Creating SVG Files
I'm embarrassed to say I spent the better half of a day trying to find an NPM package that would convert PNGs to SVG. I was under the impression, primarily because I work with raw binary data a lot, that there were some hoops I'd have to jump through when making an SVG file. That was until I opened one up and realized it's just XML with a .svg extension. Here is the basic schema for the file:
<?xml version="1.0" encoding="UTF-8" ?>
<svg version="1.1" width="320" height="320" xmlns="http://www.w3.org/2000/svg" shape-rendering="crispEdges">
...
</svg>
You can add shapes inside of the svg tags like so:
<rect x="32" y="32" width="8" height="8" fill="#000000"/>
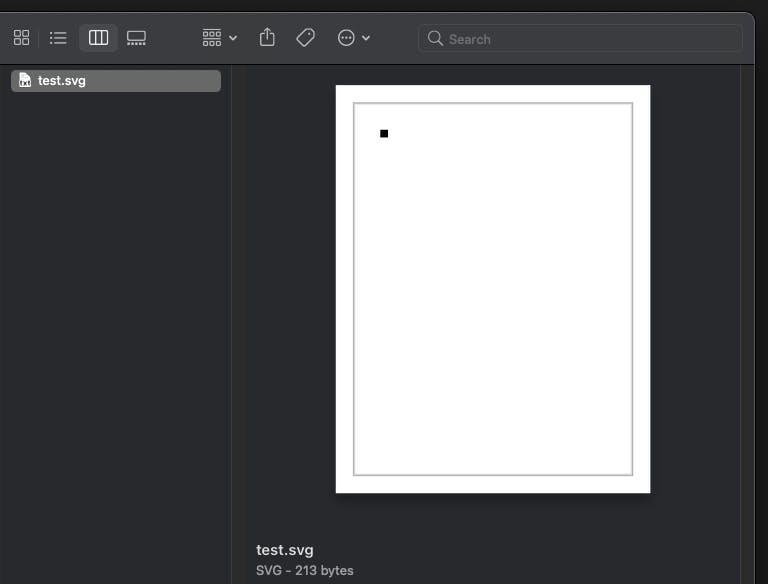
This will create an 8x8 pixel rectangle at X:32, Y:32 filled with black. And that's it! If you created a text file, put this in it, and previewed it with something that renders SVG, you'd see this.
Well, this is right in my wheelhouse. I deal with rendering individual pixels like this all the time in my Fantasy Console, Pixel Vision 8. So, I imported a few NPM packages to create a script that watches changes to a PNG file inside an in folder and exports SVG to the out folder. Usually, that would be it, but there was one extra thing I had to consider. The plotter can only draw one color at a time because it's literally holding a pen, so I made a slight modification outputted a separate SVG file for each color.
Let's take a look at how I actually went about doing this.
The Code
If you read my post on automatically converting my code into step-by-step tutorials, I used chokidar to watch files inside my project and call a function whenever it detected a change. I also needed a way to read PNG pixel data, so I found pngjs which was a bit overkill but gave me an easy way to loop through each pixel and read the RGB data. After that, it's just a matter of creating the SVG nodes. I'm also using fs and path for reading and writing on the filesystem.
I've posted the project to GitHub , so I'm not going to go over every line of code, but here are the broad strokes so you can get a sense of how things work:
- I use chokidar to look for png files inside the
infolder and pass the file paths to mytoSVG()function.
chokidar.watch('in/*.png', {
    ignored: 'node_modules'}).on('all', (event, path) => {
        toSVG(path, scale);
});
- Then, I use fs to read the file stream and pipe it into
pngjsto read the pixels.
fs.createReadStream(filePath)
    .pipe(new PNG())
    .on("parsed", function () {
- Once the PNG is loaded, I calculate each pixel's width and height based on the scale and create 2 arrays. The first array stores all of the SVG shapes to make a single image, and the second array stores layers where shapes are stored based on their fill color.
let newWidth = this.width * scale;
let newHeight = this.height * scale;
let pixelSize = scale;
let shapes = [];
let layers = {};
One thing to note is that the scale will be a 1:1 value I multiple across the board. I need to account for the scale for the overall image's width and height, and the scale modifies the size of each pixel.
- I then loop through the x and y positions of the PNG, find the RGB value for the pixel, and convert it into a HEX color.
for (var y = 0; y < this.height; y++) {
            for (var x = 0; x < this.width; x++) {
                var idx = (this.width * y + x) << 2;

                let r = this.data[idx];
                let g = this.data[idx + 1];
                let b = this.data[idx + 2];

                let hex = rgbToHex(r, g, b);
- Once I have the hex, I can check to see if there is a new layer for that color, and if not, create an array for that layer
if(layers[hex] == null)
{
    layers[hex] = []
}
- Now, I can fill in all the values for the SVG rectangle by replacing the x, y, width, height, and color from a string template I use.
let newRect = svgRect.format(x * scale, y * scale, pixelSize, pixelSize, hex);
- And with the SVG rectangle as a string, I push it into the shapes array and the array for the color layer.
shapes.push(newRect);
layers[hex].push(newRect);
- Finally, I can loop through all the shapes, create the SVG string, and write it to a file.
let svg = svgTemplate.format(newWidth, newHeight, shapes.join('\n'));
let dest = ["out", fileName+"-"+scale+"x.svg"].join(path.sep);

fs.writeFile(dest, svg, function (err) {
    if (err) return console.log(err);
    console.log(filePath, "to", dest);
});
I use a string with tokens that defines the SVG's width, height, and shapes inside the tags and another string for the shape itself. The templates look like this:
let svgTemplate =
    '<?xml version="1.0" encoding="UTF-8" ?>\n' +
    '<svg version="1.1" width="{0}" height="{1}" xmlns="http://www.w3.org/2000/svg" shape-rendering="crispEdges">\n' +
    '{2}'+
    '\n</svg>';

let svgRect = '<rect x="{0}" y="{1}" width="{2}" height="{3}" fill="{4}"/>
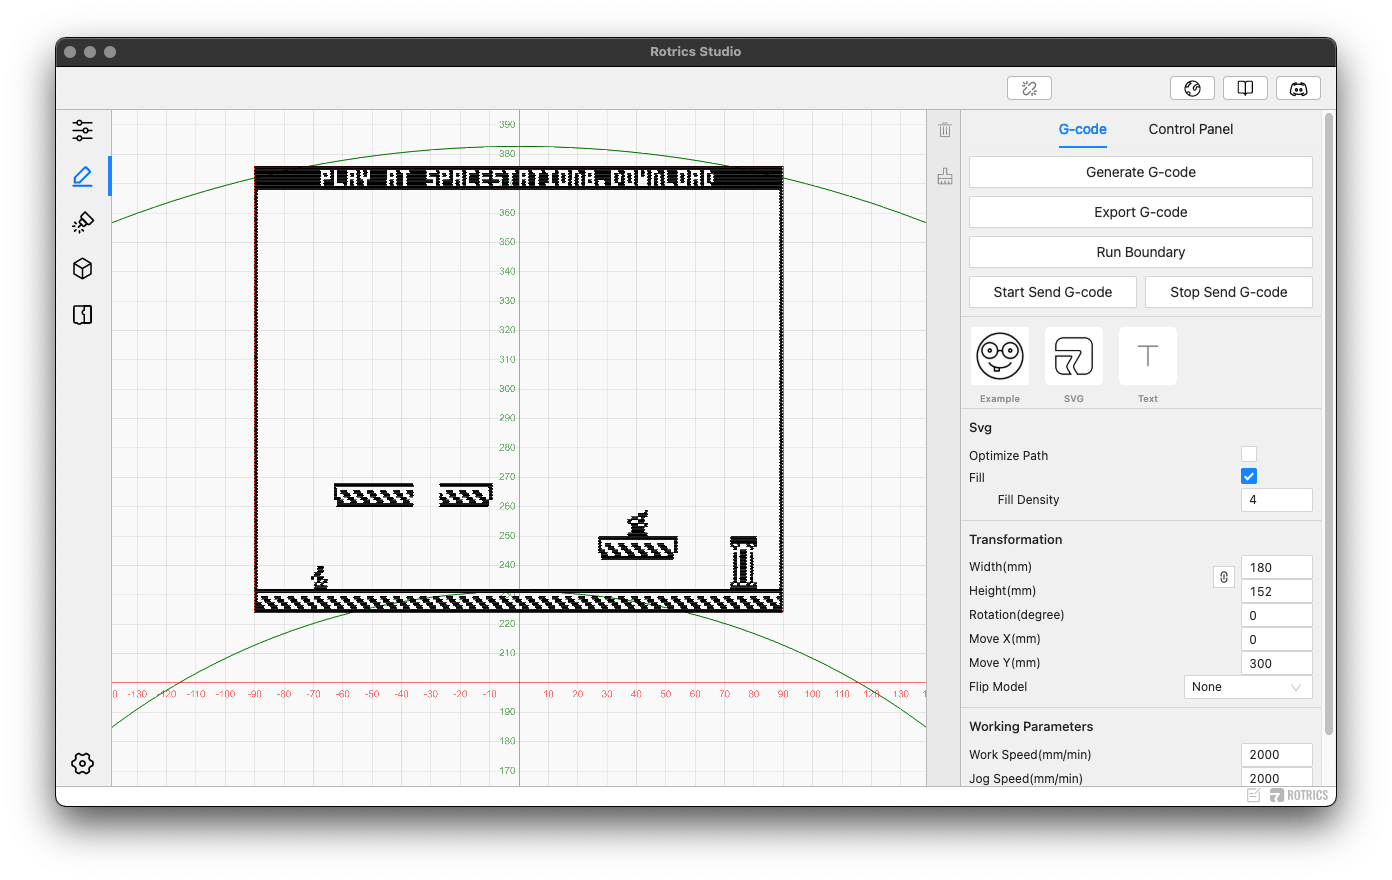
And that's it! When I save a new png to the in folder or make changes to one already there, the script automatically generates the SVG files I need for the plotter. The Rotircs DexArm has its own software that lets you import the SVG file and configure everything for plotting.
Closing Thoughts
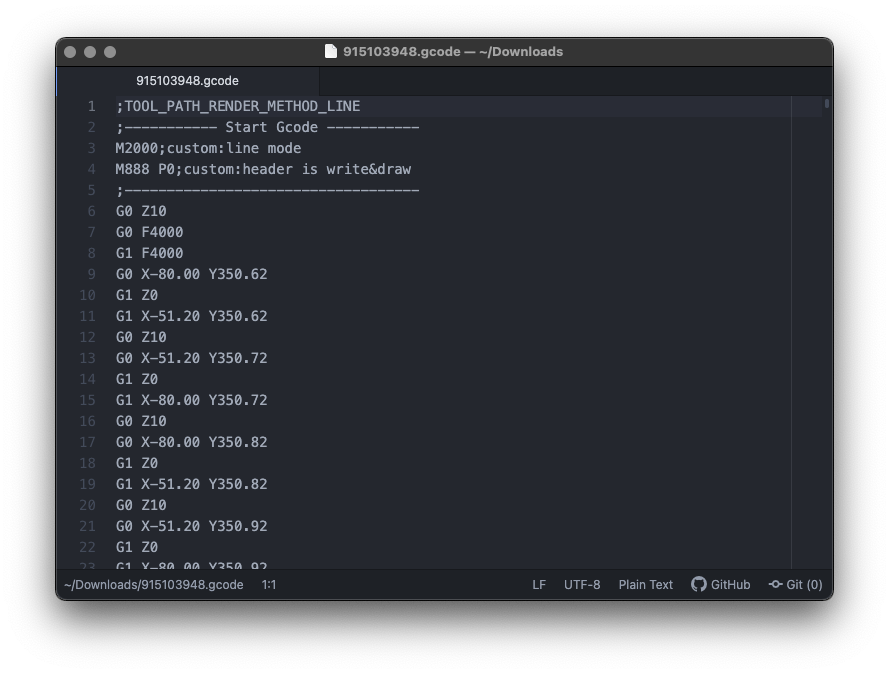
Before I end this, I wanted to share some of my thoughts on how this actually works, what I'm learning, and my ideas for improving it moving forward. I'm not going to lie, the DexArm is fascinating to watch, and I'm genuinely impressed by how "open" the software for it is. The software converts your SVG into a series of x, y, and z coordinates for the plotter to work. You can export the file it generates as flat text, so I can skip a step and probably generate the coordinates myself.
Also, the Rotrics Studio app appears to just be a web app wrapped in an executable using electron or something similar. I accidentally noticed this when I toggled debug mode and got Chrome's debug console.
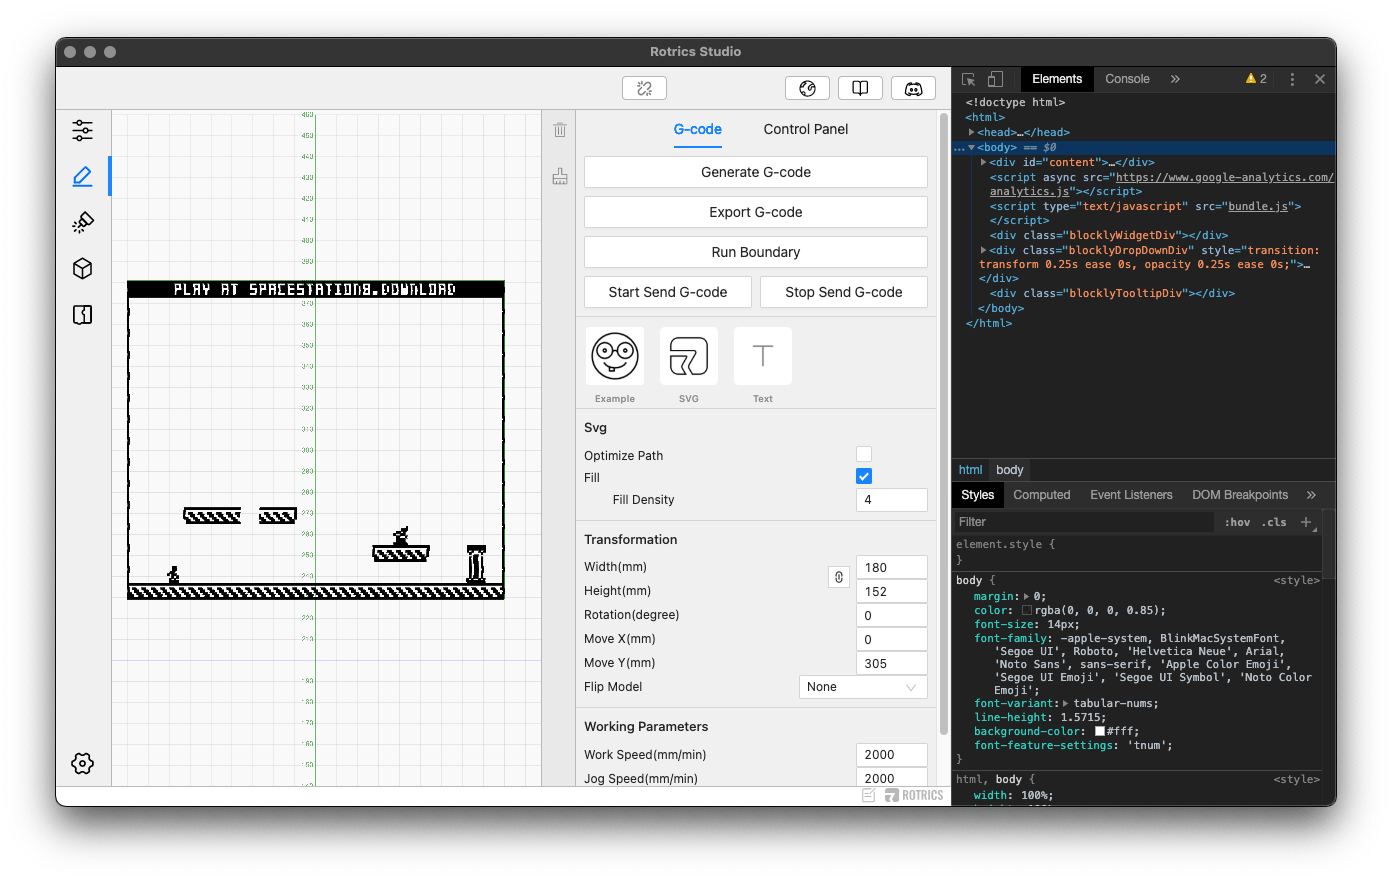
That made me happy because it means I can hack apart the app and extend it to do more based on my needs. One of the reasons I went with this instead of a traditional plotter was because it's open and reprogrammable. A lot can be done with an arm, and I hope those possibilities help extend my interest in this project.
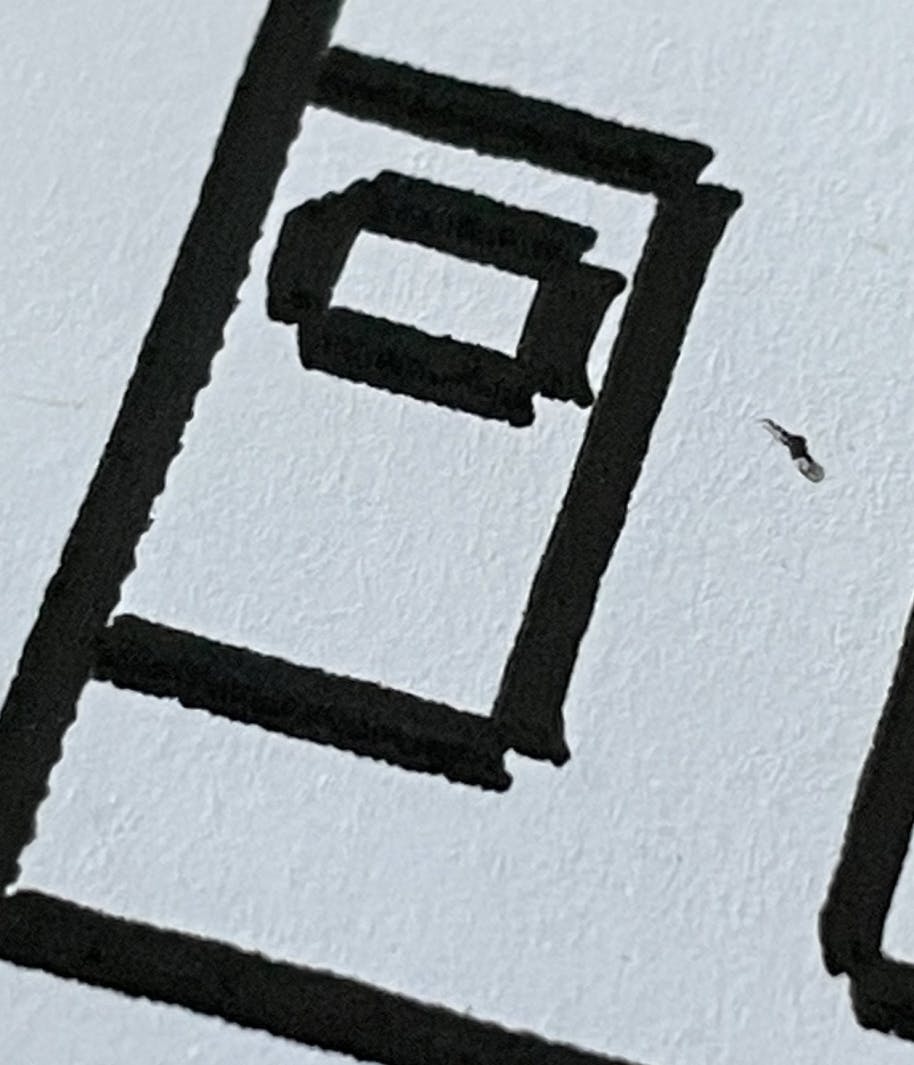
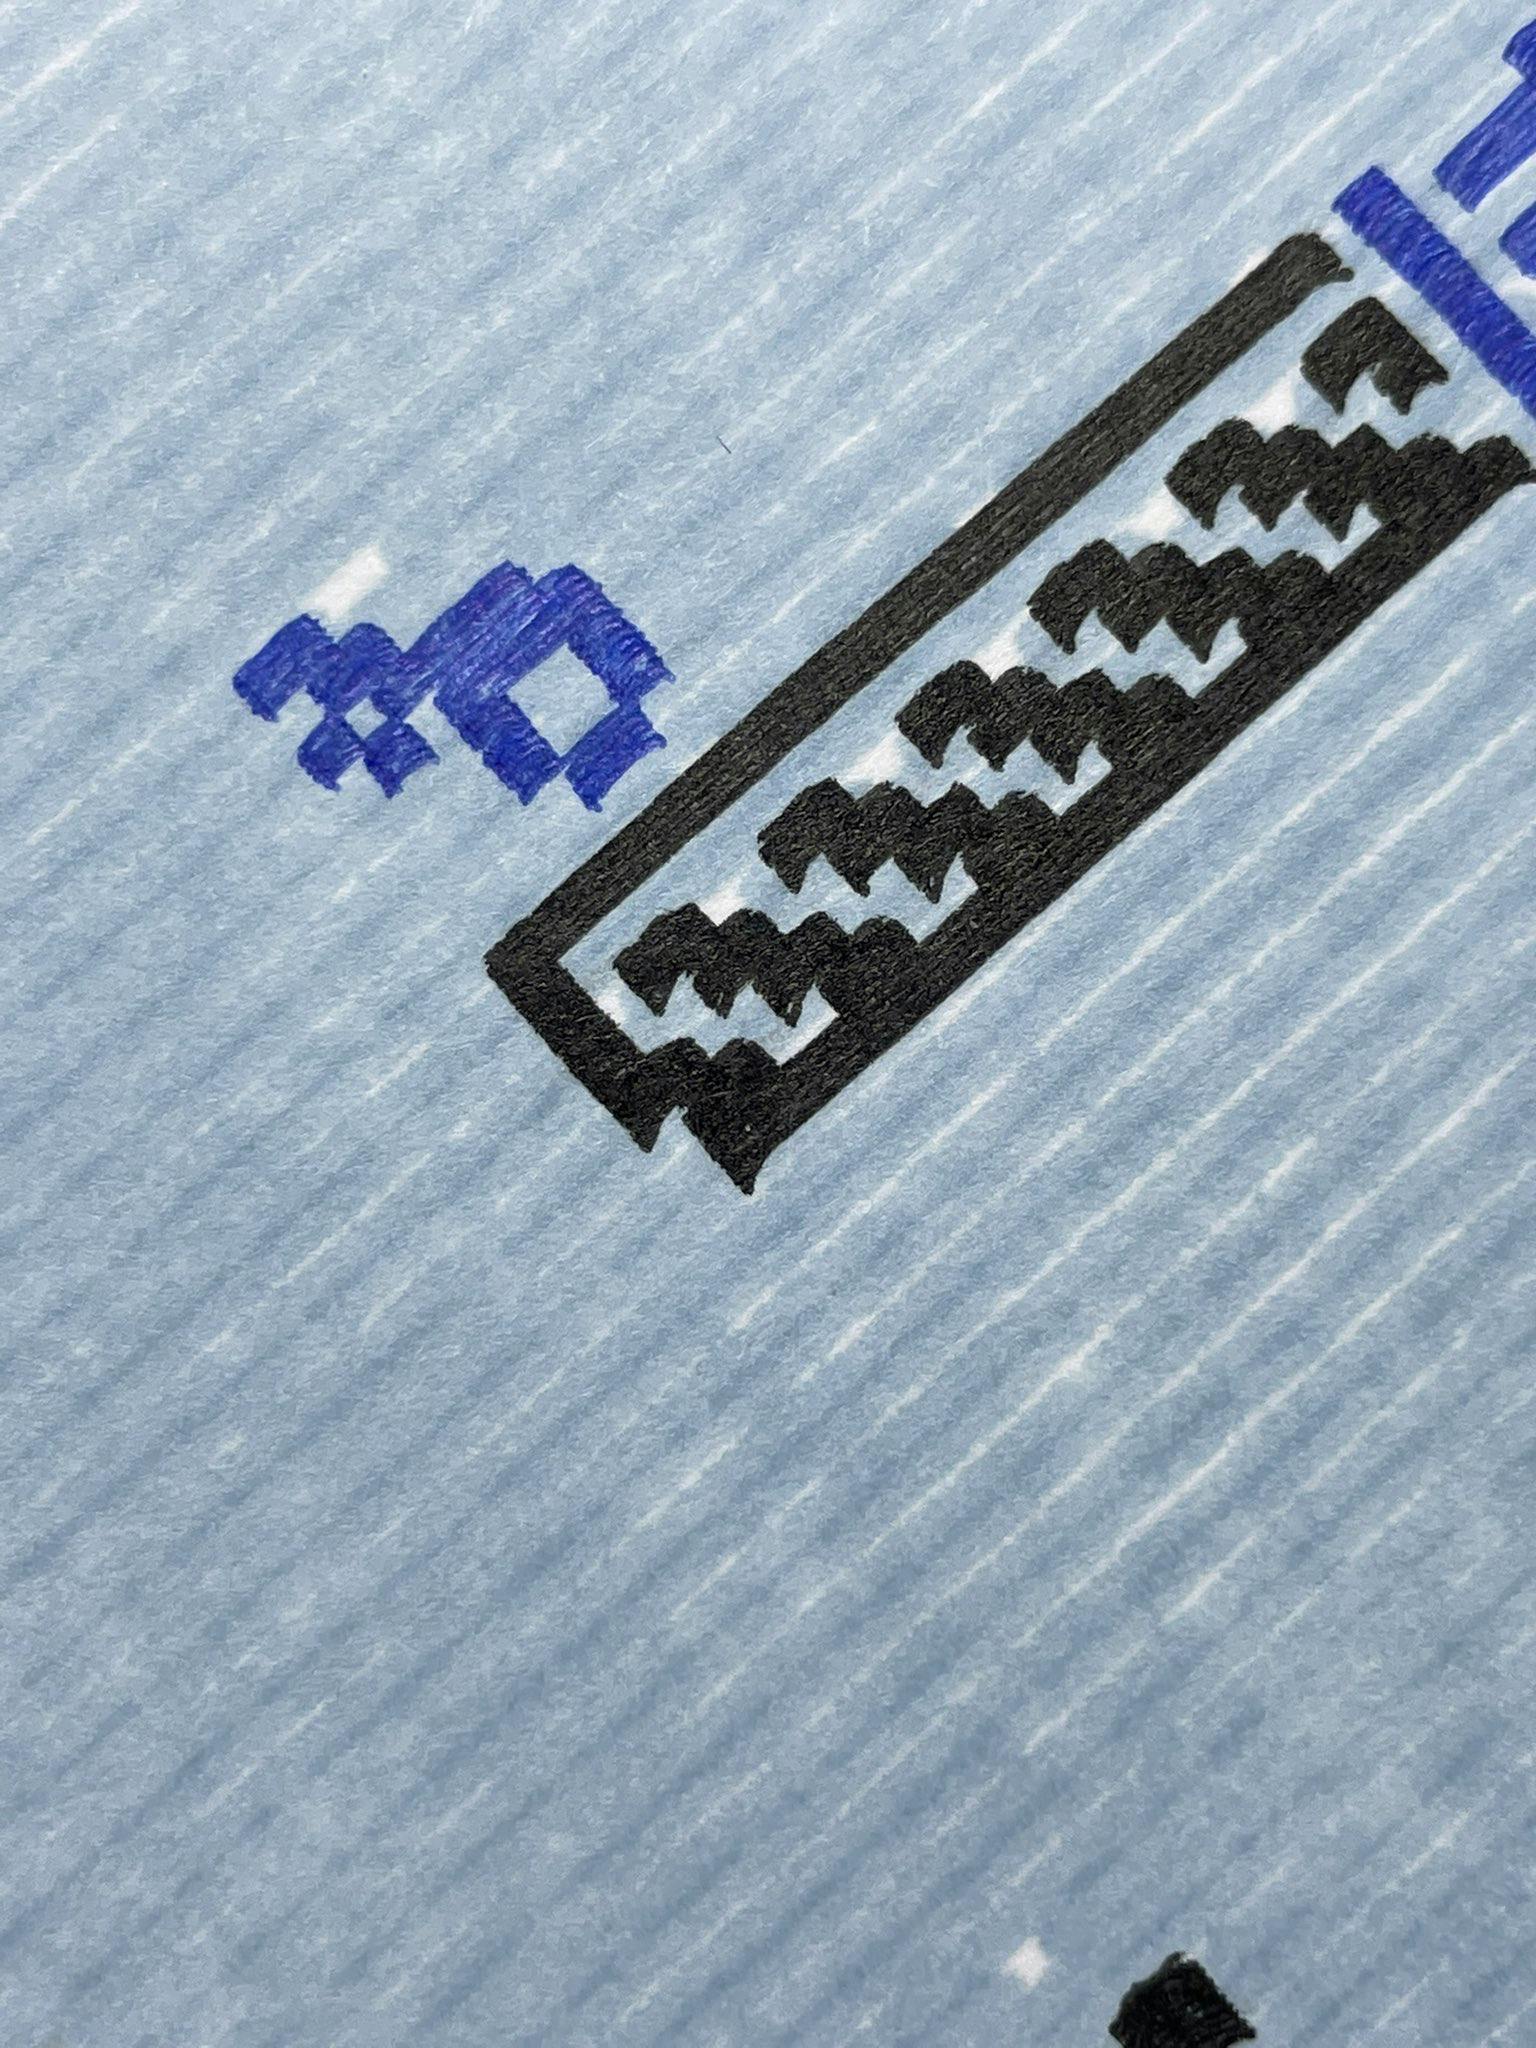
Now for the not-so-great news. The DexArm's biggest strength is also its greatest weakness. When using the arm as a plotter, there is a considerable amount of wobble when it draws. I noticed it when doing SVG shapes and in the pixel art, I'm currently using. The arm jabs down and away when it does some kinds of strokes, and it warps the edges, making the ink bleed outside of the bounds.
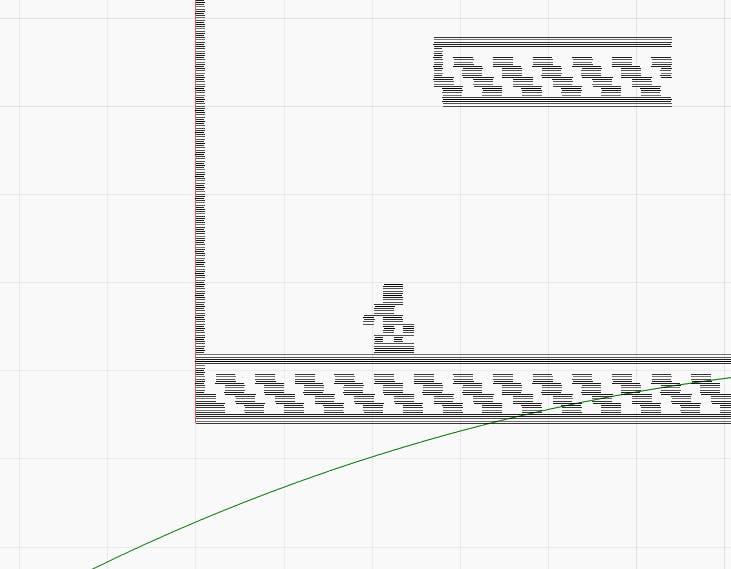
I imagine I can correct this by optimizing my SVG to use more long strokes, but as of now, it's a bit annoying, especially for something that costs this much money. You can see how it breaks down an image into horizontal strokes and each line has the potential to create a wobble as the arm moves back and forth.
But, I knew going in that getting something that does multiple things means it won't excel any of them. I would rather live with imperfections than fill my office with additional hardware. This arm is compact, portable, and looks really cool in the background while I'm in meetings, and it's just plugging away plotting out my pixel art on paper.
I am not sure I'd recommend this, but you'd probably get a lot of bang for your buck if you have the money and like open hardware. Knowing nodejs, working with pixel data, and setting aside a few hours allowed me to make my own solution for a problem without relying on the creators or some other 3rd party service. Solving problems with code is an excellent skill to have, and hopefully, it inspires you to take your own dev skills and apply them to problems outside of the traditional space you usually work in.
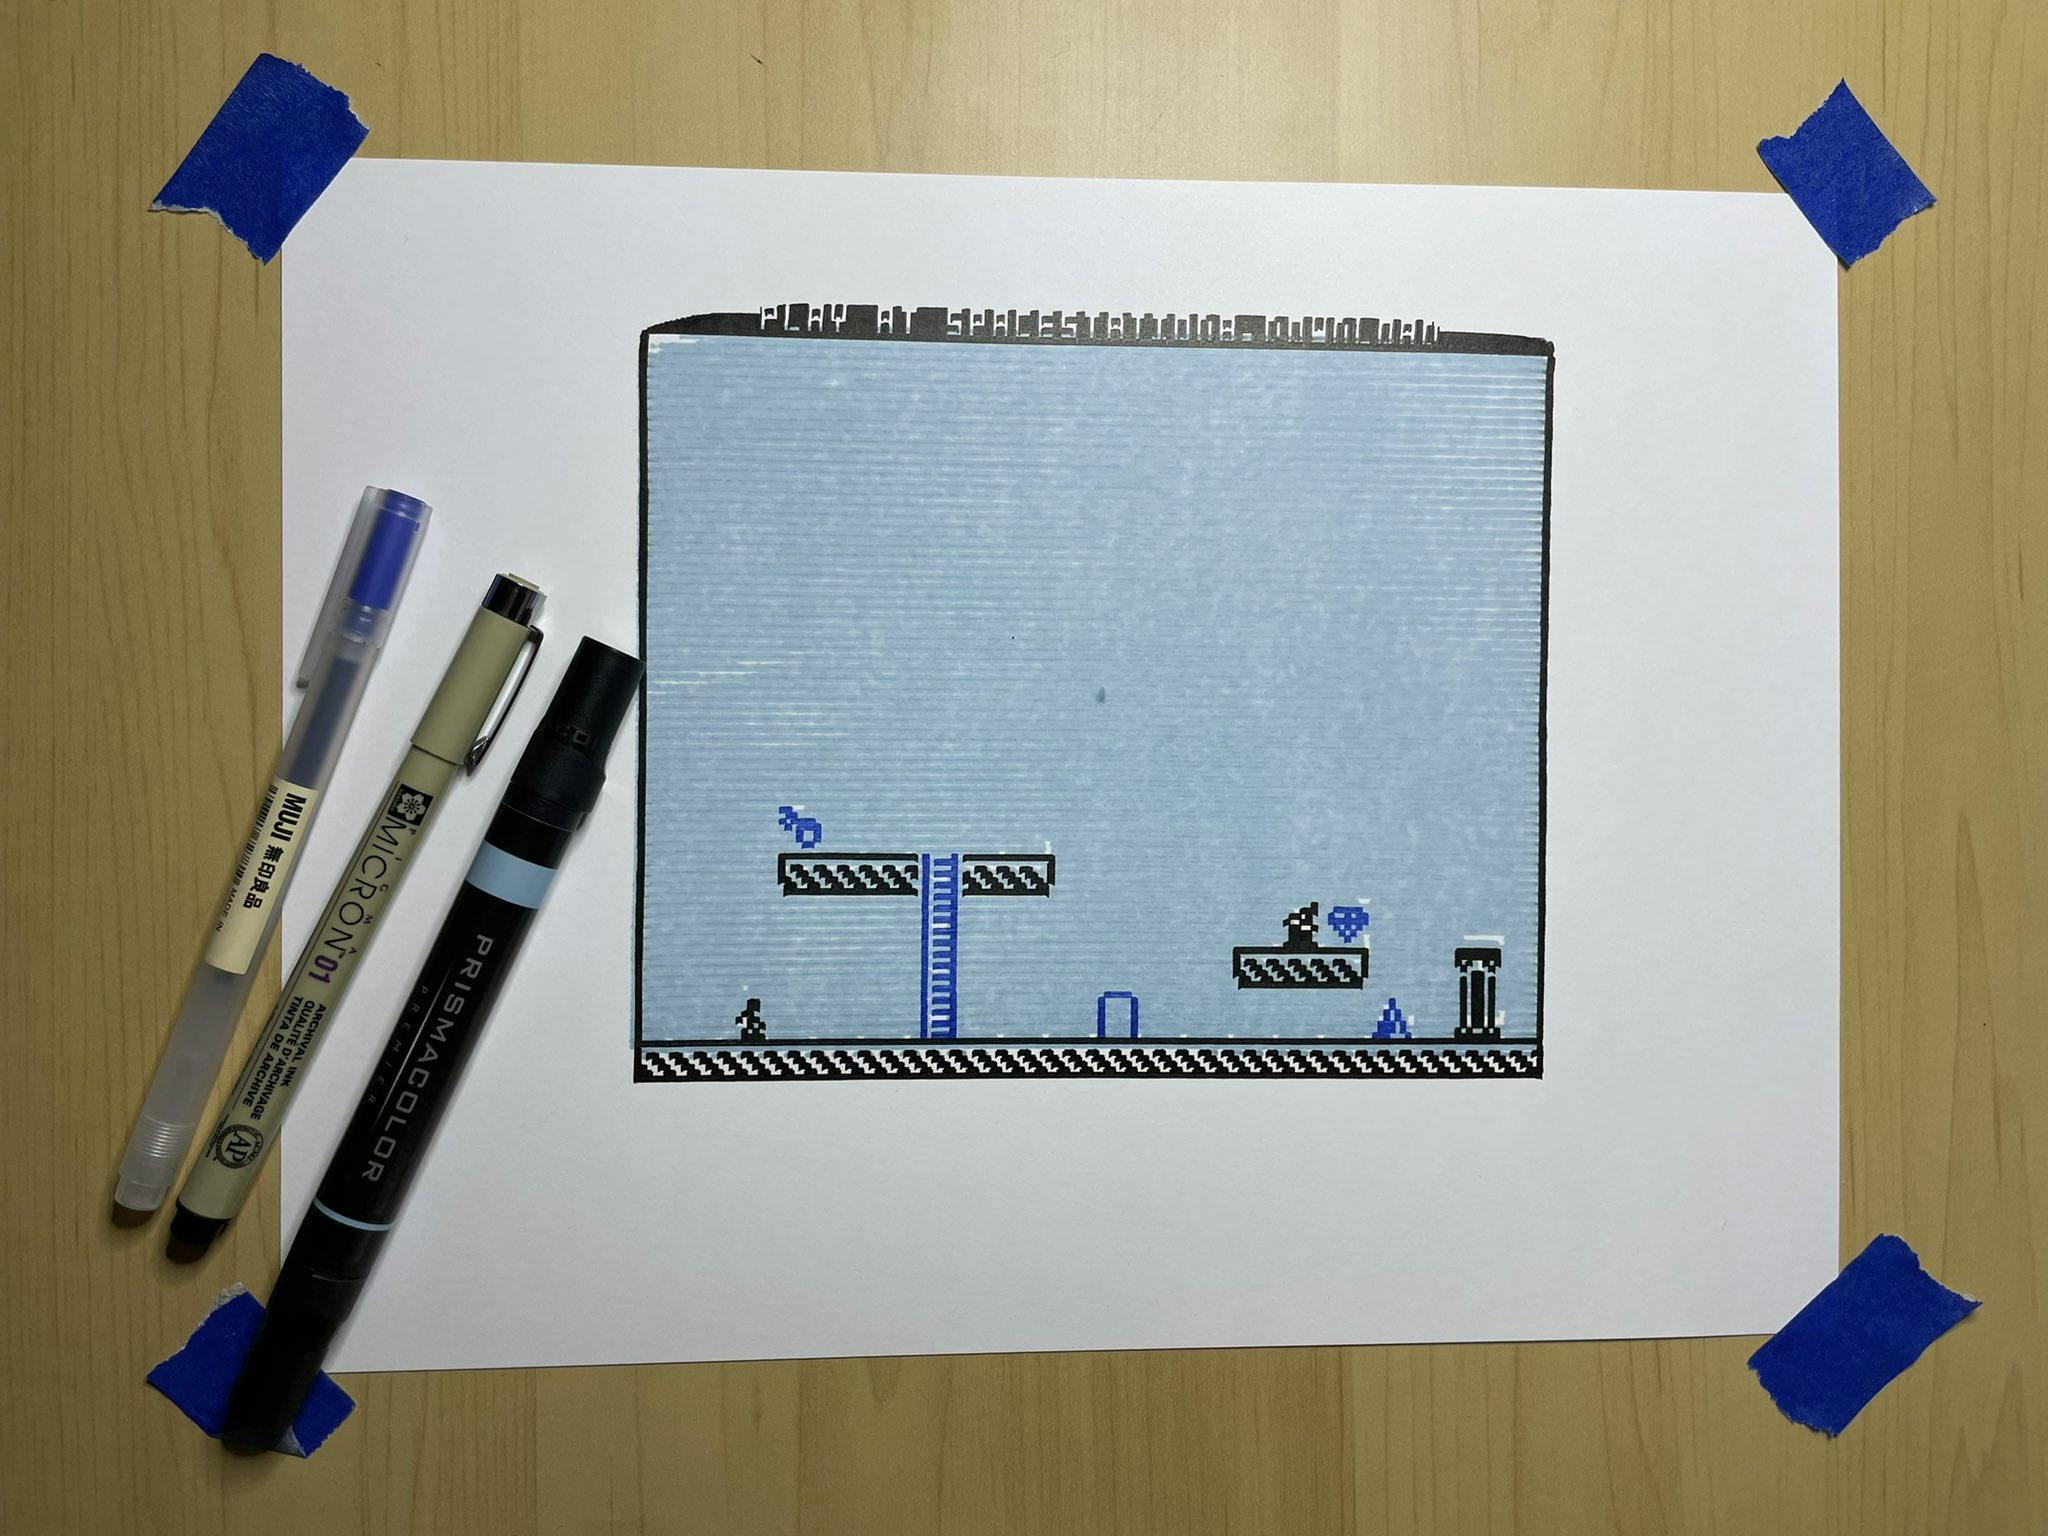
Here is the final print I made this morning after my initial experimentation:
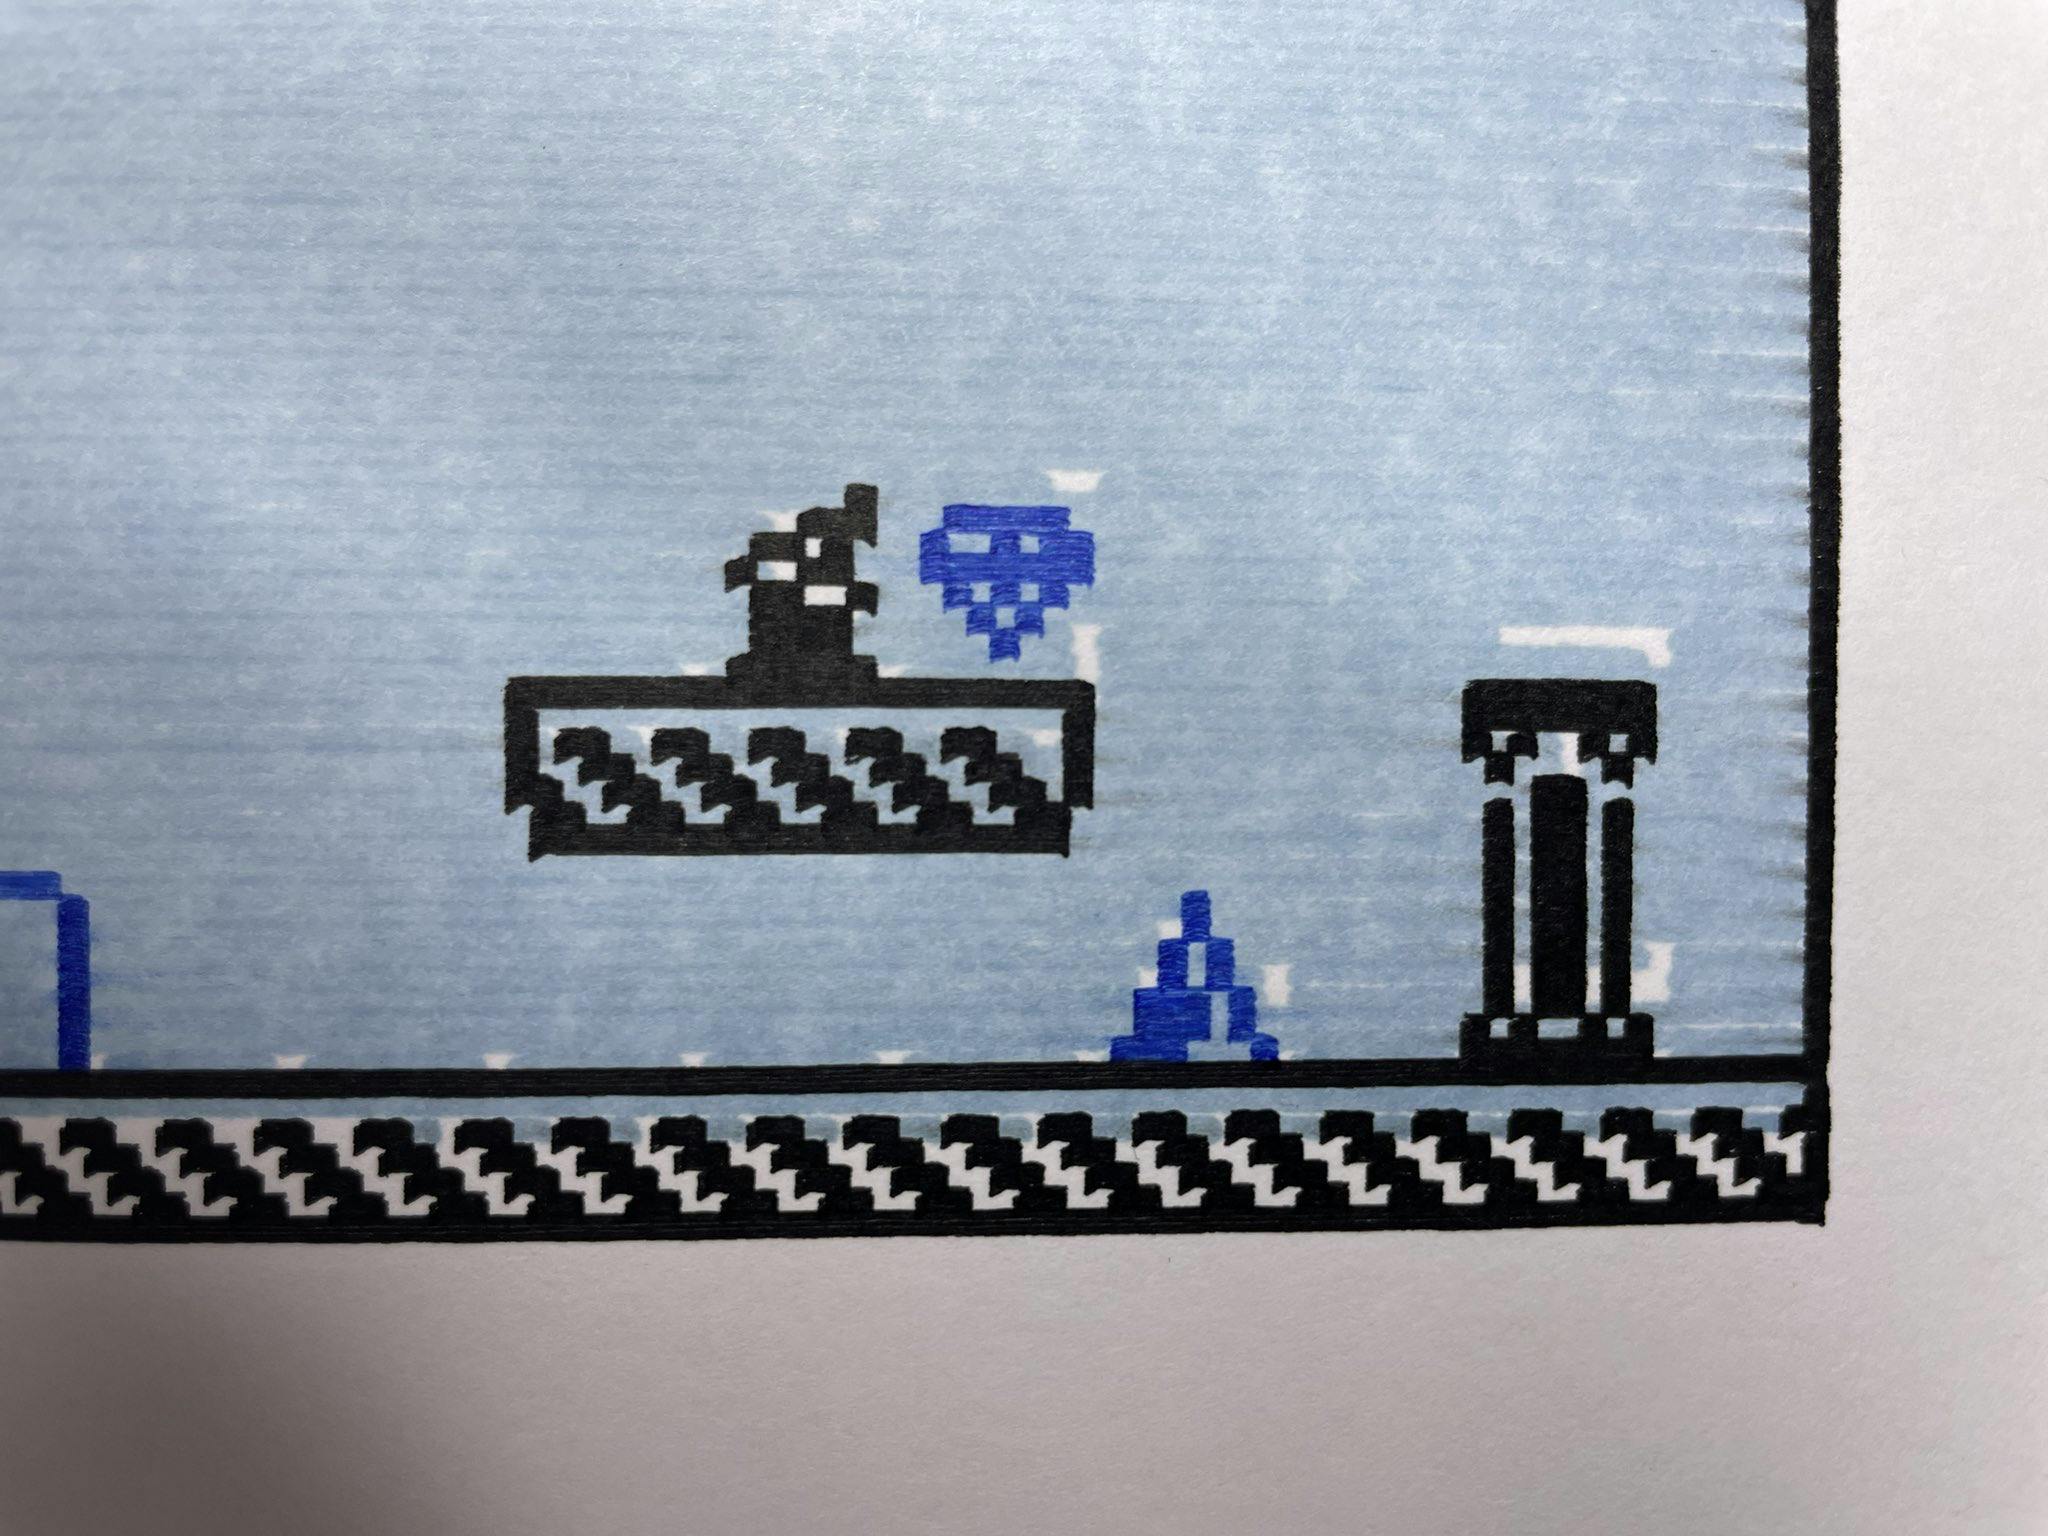
If you like this project, please leave a 👍 and ⭐️ on Github. I'm still on the fence about keeping this thing but even with the flaws, it's a lot of fun to watch it do its thing.